Running Spark Applications and Spark Web UI interface for monitoring -Complete Guide
Spark Web UI interface for monitoring applications

Running Spark Applications: A Complete Guide
Apache Spark is a powerful open-source distributed computing system that enables big data processing at scale. To make the most of Spark, understanding how to efficiently run Spark applications is crucial. In this guide, we'll explore the different ways to run Spark applications and how to monitor Spark clusters effectively.
Running Spark Applications: Local vs. Cluster Mode
You can run Spark applications either locally or in a distributed cluster environment. The choice depends on your data size, computational requirements, and development stage.
-
Local Mode: Ideal for testing and small data processing tasks. It allows you to run Spark on a single machine without requiring a cluster.
Command to run locally:
spark-submit --master local[4] my_spark_app.pyHere,
local[4]specifies the number of cores to use. -
Cluster Mode: Used for large-scale distributed data processing. You can submit applications to clusters managed by YARN, Mesos, or Kubernetes.
Command for cluster mode:
spark-submit --master yarn --deploy-mode cluster my_spark_app.pyIn this case, the Spark driver runs inside the cluster, improving fault tolerance and scalability.
Interactive Shell for Ad Hoc Analysis
During the data exploration phase, running Spark interactively is beneficial. You can use the Spark shell or PySpark shell for quick analysis and debugging.
-
For Scala:
spark-shell -
For Python:
pyspark
Monitoring Spark Clusters and Applications using CMD
Monitoring your Spark applications is essential for performance tuning and debugging. Spark provides several tools for monitoring:
-
Command-Line Tool: The
spark-submitcommand can be used to check the status of running jobs and resources.yarn application -list -
Metrics Dashboard: Integrate with tools like Prometheus and Grafana for advanced monitoring.
Monitoring Spark Jobs Using Spark UI
Monitoring your Spark job performance is crucial for optimizing execution time and identifying bottlenecks. The Spark UI provides a comprehensive way to monitor job execution in real-time.
Step 1: Access Spark UI
-
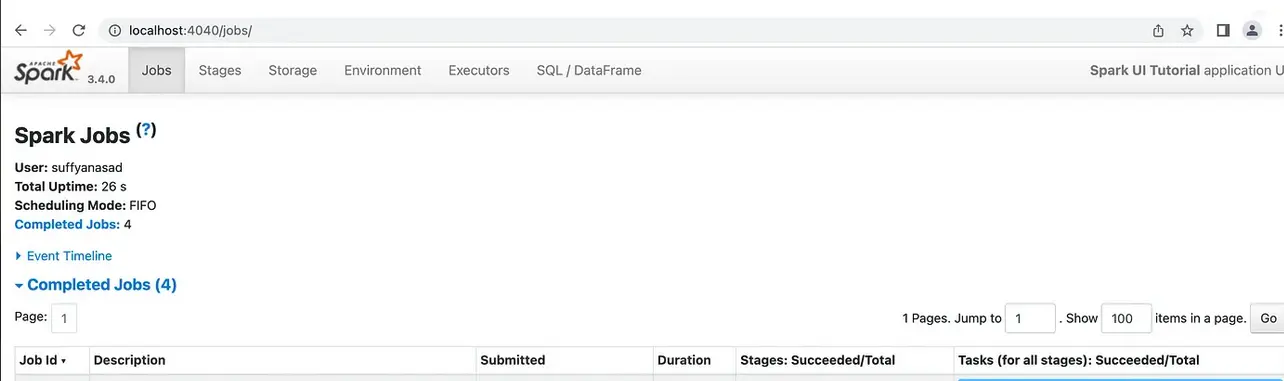
When a Spark application is running, open your browser and navigate to:
This is the default port for Spark UI. If port 4040 is busy, Spark will switch to 4041 or the next available port. The logs will indicate the correct port.http://localhost:4040
Step 2: Monitor Jobs Overview
- The Jobs tab provides a high-level view of all completed and in-progress jobs.
- For each job, you can view the number of stages, execution time, number of tasks, and success/failure status.
Step 3: View Event Timeline
- Expand the Event Timeline section to visualize the execution timeline of jobs and stages.
- It shows events like task start and end times, executor addition/removal, and shuffle operations.
Step 4: Analyze Stages View
- Click on the Stages tab to inspect individual stages within a job.
-
For each stage, you can view:
- Input data size
- Shuffle read and write size
- Number of tasks
- Skipped stages
Step 5: DAG Visualization
- Within the Stages tab, expand DAG Visualization to see the Directed Acyclic Graph (DAG) representation of the job.
- This helps in understanding task dependencies and execution flow.
Step 6: Inspect Task Details
-
For deeper analysis, click on a stage to view detailed information about each task, such as:
- Execution time
- Garbage Collection (GC) time
- Input and output data size
- Shuffle read/write time
- Standard output and error logs
Step 7: SQL/DataFrame View
- Navigate to the SQL/DataFrame tab to monitor query execution plans and performance metrics for each query.
Step 8: Storage View
- The Storage tab shows information about cached RDDs and DataFrames.
- You can view memory and disk usage for persisted data.
Step 9: Environment View
- The Environment tab provides information about the Spark configuration, including JVM settings and system properties.
Step 10: Executors View
-
The Executors tab shows detailed metrics for each executor, such as:
- Active, completed, and failed tasks
- GC time
- Input and shuffle data size
- Logs for each executor
By following these steps, you can effectively monitor and troubleshoot your Spark jobs for improved performance and resource management.
Reference Link: Apache Spark Web UI Documentation
Conclusion
Running Spark applications efficiently requires choosing the right execution mode and leveraging the right monitoring tools. By mastering local and cluster execution modes and utilizing the Spark Web UI for monitoring, you can optimize performance and effectively handle big data workloads.
Table of content
- Introduction to Apache Spark
- Spark Architecture & Components
- Working with Spark Shell
- Core Spark Concepts
- Working with Data in Spark
- Spark DataFrames
- Spark SQL
- Dataset API
- Handling JSON, CSV, and Parquet
- Spark Streaming
- What is Spark Streaming?
- Structured Streaming
- Processing Real-time Data
- Performance Optimization
- Spark Execution Plan
- Broadcast Variables & Accumulators
- Caching & Persistence
- Optimizing Shuffle Operations
- Machine Learning with Spark
- Introduction to MLlib
- Classification & Regression
- Clustering & Recommendation Systems
- Job Deployment & Cluster Management
- Job Deployment in Spark
- Running Spark on YARN, Mesos, and Kubernetes
- Monitoring & Debugging Spark Jobs
- Advanced Spark Topics
- GraphX (Graph Processing in Spark)
- Spark with Hadoop & HDFS
- Security in Spark
- Spark Interview Preparation
- Additional Spark Resources